HOLD OR SELL? THE MATH YOUR GUT DOESN'T KNOW

A disciplined yearly exercise turns intuition into strategy and protects the wealth you have spent a lifetime building.
Every year, thousands of Canadian business owners wake up wondering the same thing: is now the time to sell, or should I keep building? It is one of the most consequential decisions an entrepreneur will ever make, yet most tackle it with little more than instinct and anecdote.
There is a better way. A structured annual valuation, conducted with the discipline of a finance professional and the self-knowledge of a founder, transforms that gut-level debate into a data-driven conversation. For owners of mid-sized Canadian companies generating between $5 million and $50 million in annual revenue, this exercise is not a luxury. It is a strategic imperative.
The core question: intrinsic value vs. market value
At the heart of any hold-or-sell analysis are two numbers that rarely match, and whose gap tells you almost everything you need to know.
Intrinsic value is what your business is fundamentally worth based on its own merits: normalized earnings, forward cash flows, competitive position and unique assets such as long-term contracts, proprietary processes or key customer relationships. Techniques like discounted cash flow (DCF) analysis or normalized EBITDA multiples are the standard tools. For Canadian firms, intrinsic value often incorporates factors such as regional expansion opportunities, federal incentive eligibility and the depth of the management team.
Market value is what a willing buyer would pay today, derived from comparable transactions in your sector and adjusted for size, geography and liquidity. Databases such as BizBuySell and PitchBook track Canadian deal activity and serve as useful reference points, though all private-market transactions require a further adjustment for illiquidity, governance quality and business risk.
Important methodology note: The opportunity cost comparisons in this article assume that your business and the S&P/TSX Composite Index operate in industries with identical growth prospects. In practice, your sector may have materially different tailwinds or headwinds. A company in a high-growth technology or healthcare niche may have growth prospects that significantly exceed the broad index. Conversely, a business in a structurally declining sector may fall short. Owners must apply their own sector analysis to this framework, or engage an advisor who can provide an independent sector assessment. The TSX benchmark is used here for illustrative purposes only.
Why private businesses trade at a discount: governance, compliance and the illiquidity gap
To understand why a private business is worth less per dollar of earnings than an equivalent public company, you need to understand what a public company offers that a private one does not. The discount is not arbitrary. It is the market's pricing of real structural differences in governance, transparency, legal compliance and risk.
The public company standard
When a sophisticated buyer evaluates a public company, they inherit a set of institutional protections that reduce their risk and increase their confidence in the asset they are acquiring. These protections do not exist by default in private lower-middle-market businesses. The following table maps the gap.
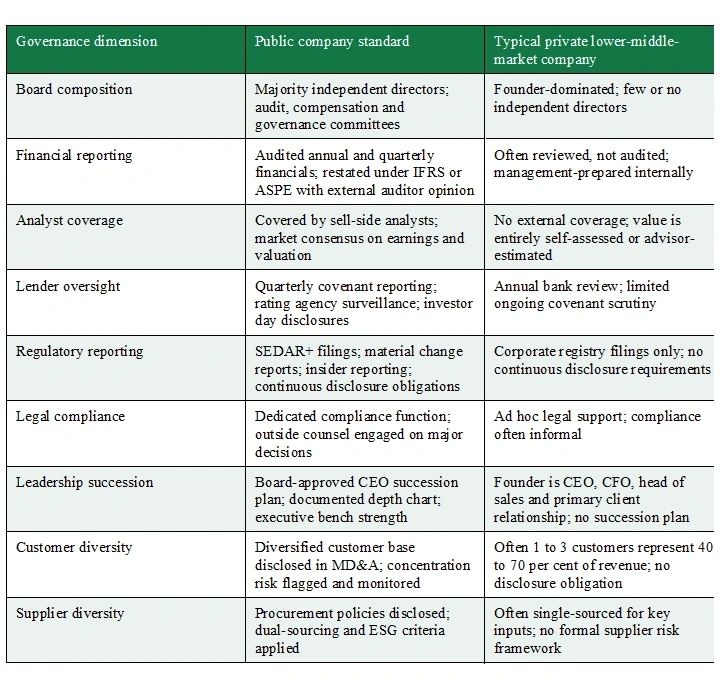
Each gap in the table above represents a discount in the buyer's mind. Independent board members provide oversight that protects against management self-dealing and ensures strategic decisions are made in shareholders' interests, not just the founder's. Audited financial statements give a buyer confidence that the numbers they are underwriting are accurate and have been tested by a qualified external party. Analyst coverage and lender oversight create a continuous independent check on the business's performance that simply does not exist in the private market.
Regulatory reporting obligations, the continuous disclosure requirements that public companies must meet through SEDAR+ filings, material change reports and insider reporting, create a level of transparency that private buyers must replicate through costly and time-consuming due diligence. Legal compliance frameworks, typically staffed by dedicated in-house counsel or outside firms engaged on standing retainer, reduce the risk of regulatory exposure that a private buyer must assess without the benefit of an established track record.
The four risk factors buyers price hardest
Leadership succession: If you are the founder, you are likely also the CEO, the head of sales, the primary client relationship and the institutional knowledge of the organization. When you leave, the buyer is not just acquiring a business. They are acquiring a problem. A documented succession plan, a functioning management team and a demonstrable track record of leaders other than the founder making consequential decisions all compress the succession risk discount.
Customer diversity: A business where one to three customers represent 40 to 70 per cent of revenue is not a business, it is a dependency. Buyers price this concentration heavily because the departure of a single client can render the acquisition worthless. Diversifying your customer base to no single customer exceeding 15 to 20 per cent of revenue is one of the most reliable ways to reduce your illiquidity discount before a sale. This work takes time, typically two to three years of deliberate business development, which is another reason the annual valuation review matters.
Supplier diversity: Single-sourced inputs create supply chain fragility. If your primary supplier faces a disruption, a regulatory issue or a price shock, your margins and delivery commitments are immediately at risk. Buyers who identify single-supplier dependency will either reprice the deal or insert contractual protections that shift the risk back to you. A documented dual-sourcing strategy and a diversified supplier base reduce this exposure and demonstrate operational maturity.
Illiquidity: The structural cost of owning an asset you cannot sell on an exchange in seconds. In the Canadian lower-middle market, illiquidity discounts typically range from 20 to 40 per cent relative to public-market comparables. The size of the discount is directly influenced by business size, revenue concentration, owner dependency, sector cyclicality, the quality of financial records and the governance factors listed above.
Owner's note: Reducing your governance gap before going to market is one of the highest-return activities available to any owner. Audited financials, independent directors, a functioning management team, a diversified customer and supplier base and documented legal compliance all translate directly into a lower discount and a higher net price. This is not a pre-sale checklist. It is a multi-year programme that should begin well before any exit conversation.
For minority shareholders in family-run or closely held enterprises, a second adjustment applies: a discount for lack of control. A 30 per cent stake in a private company carries no board authority, no ability to compel a dividend and no guarantee of an exit. Valuators typically apply a discount for lack of control of 15 to 35 per cent on top of the illiquidity discount, compressing minority values further.
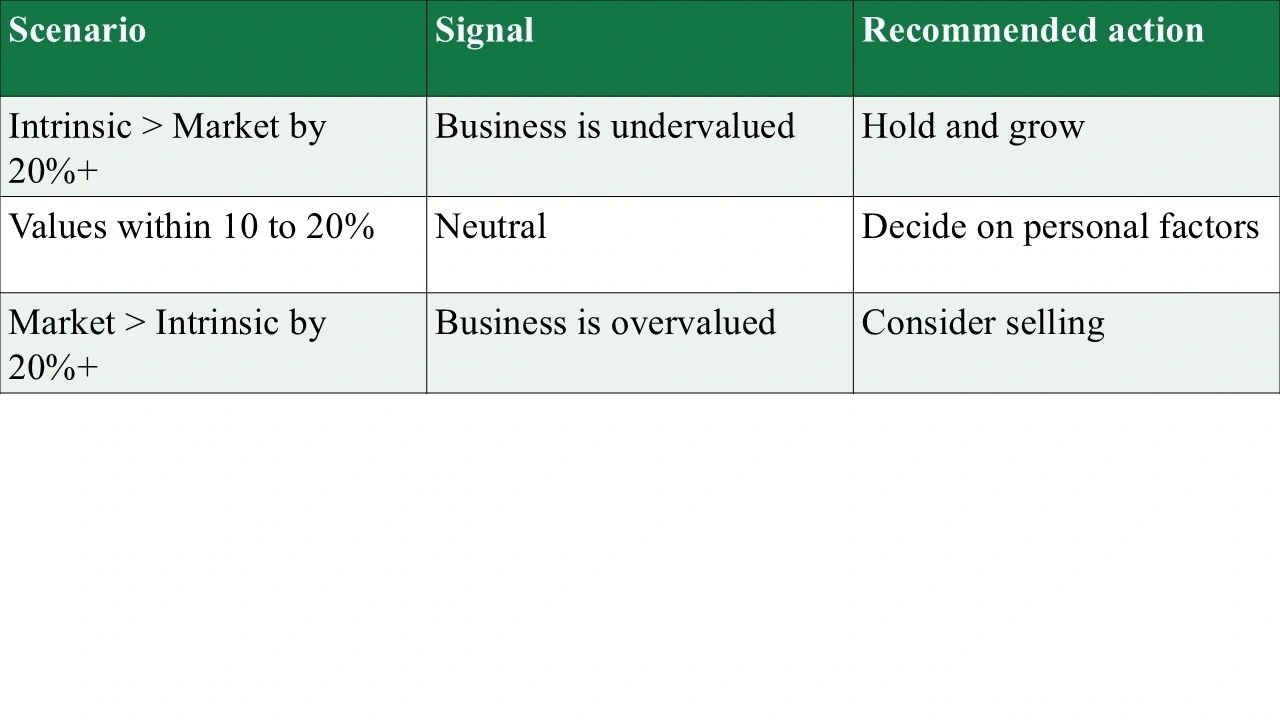
A simple framework for reading the gap
Once you have both numbers, the decision matrix is straightforward.
The tax variable: what the inclusion rate means for your net proceeds
No hold-or-sell decision is complete without modelling after-tax outcomes. The difference between the current and a hypothetical higher capital gains inclusion rate can be the difference between a comfortable retirement and a shortfall.
Where Canada stands today
Canada's capital gains inclusion rate, the share of a capital gain treated as taxable income, currently sits at 50 per cent for individuals. If you sell your business and realize a $7.5 million capital gain, $3.75 million of that is added to your taxable income in the year of sale. The Lifetime Capital Gains Exemption (LCGE), now set at $1.25 million on the sale of qualifying small business corporation shares following its increase effective June 25, 2024, shelters a meaningful portion of that gain from tax entirely.
The Freeland proposal: what a higher rate looks like
In Budget 2024, tabled April 16, 2024, then-Deputy Prime Minister and Finance Minister Chrystia Freeland proposed increasing the inclusion rate from 50 per cent to 66.67 per cent, effective June 25, 2024. For individuals, the higher rate would apply to capital gains above $250,000 annually. For corporations and most trusts, the 66.67 per cent rate would apply to all capital gains, with no threshold. The government projected the measure would raise $19.4 billion over five years (Government of Canada, June 10, 2024).
After a series of deferrals and the prorogation of Parliament, the Carney government cancelled the proposed inclusion rate increase on March 21, 2025. The inclusion rate remains 50 per cent.
Why the cancellation does not mean the risk is gone
Canadian business owners would be imprudent to treat the current rate as a permanent fixture. The case for revisiting a higher inclusion rate is structural, not ideological, and it rests on a fiscal reality that no government can indefinitely defer.
Canada's federal accumulated deficit stood at $1,266.5 billion as of March 31, 2025, representing a federal debt-to-GDP ratio of 41.2 per cent (Government of Canada, Annual Financial Report, 2025). Budget 2025 projects a deficit of $78.3 billion in 2025-26, the highest outside recessionary periods since 1995-96 (TD Economics, November 2025). The Parliamentary Budget Officer projects the federal debt-to-GDP ratio will remain well above its pre-pandemic level of 31.2 per cent through the end of the decade (PBO, March 2025).
Governments carrying structural deficits and elevated debt-to-GDP ratios have two levers: reduce spending or raise revenue. In practice, both are used. Capital gains, dividend income and business sale proceeds are among the most administratively tractable revenue sources available to a federal government seeking to broaden the tax base without increasing consumption taxes. The 2024 proposal was cancelled, but the underlying fiscal pressure that motivated it has not improved. A future government, of any political stripe, that faces sustained deficits and rising debt service costs will face the same limited menu of options.
This is not a prediction. It is a planning scenario. Prudent owners run their exit analysis against both the current 50 per cent inclusion rate and a higher-rate scenario consistent with the Freeland proposal. The table below illustrates the difference.
What the numbers look like side by side
The following table applies both inclusion rates to an illustrative sale of a private Ontario business with $8 million in gross proceeds and a $500,000 adjusted cost base, after applying the current $1.25 million LCGE, using the Ontario combined federal-provincial top marginal rate of approximately 53.53 per cent for illustrative purposes.
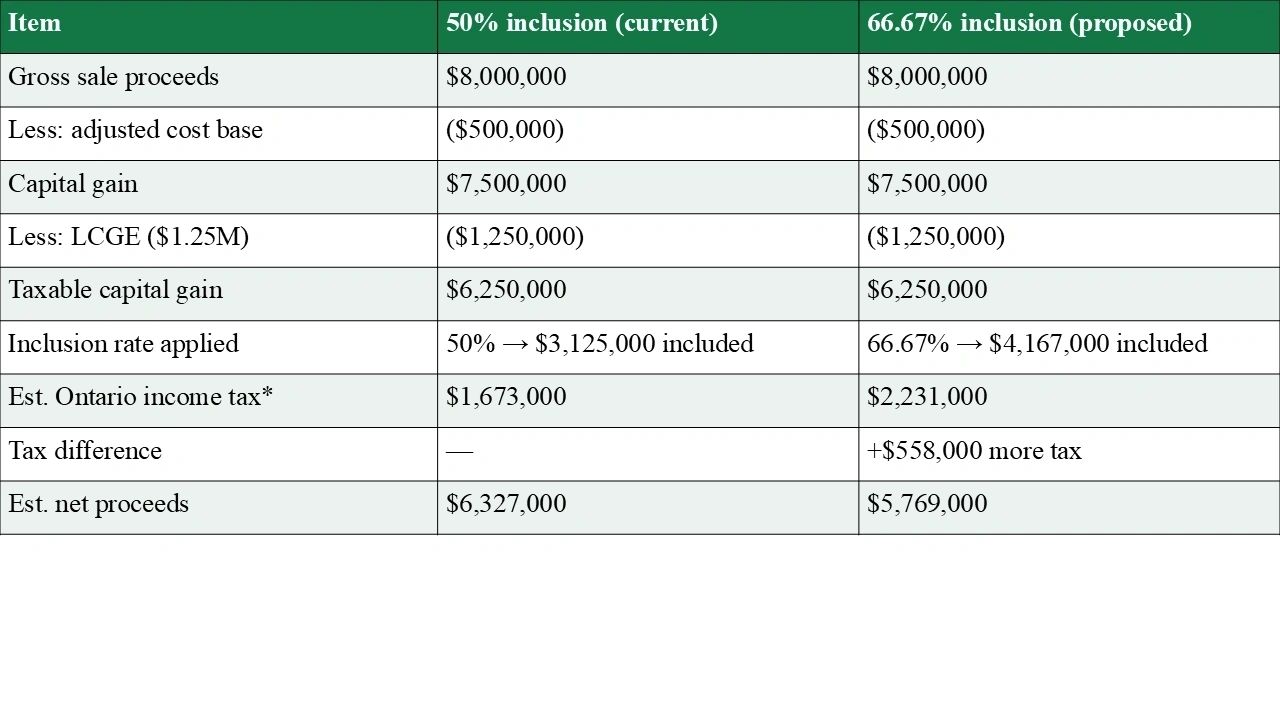
At the proposed 66.67 per cent inclusion rate, the seller in this example would pay an estimated $558,000 more in income tax, reducing net proceeds from approximately $6.33 million to $5.77 million. That is a nine per cent reduction in take-home value from a single line-item policy change.
Tax disclaimer: The tax calculations above are hypothetical and for illustrative purposes only. They do not constitute tax advice. Actual outcomes depend on individual circumstances, province of residence, adjusted cost base, use of exemptions and credits, corporate structure and many other factors. Always consult a qualified tax advisor and chartered professional accountant before making any exit decision.
Opportunity cost: the benchmark you should be beating
Every year you hold your business, your equity is not available to invest elsewhere. That is not a hypothetical cost. It is a real one, and it compounds.
The S&P/TSX Composite Total Return Index, which includes all dividends reinvested, has delivered an annualized total return of over 8 per cent per year over a 25-year period ending August 2023, according to S&P Dow Jones Indices. Over the past decade, the index has averaged approximately 9.3 per cent per year on a total return basis (PortfoliosLab, December 2025). Over rolling 10-year periods, the index has produced positive returns in 100 per cent of measured intervals.
This benchmark matters because it is the most accessible, liquid, low-cost alternative to holding a concentrated private equity position in your own company. You do not need a relationship, a board seat, management oversight or key-person insurance to own the TSX. You need a brokerage account.
Sector growth assumption: The TSX Composite reflects a diversified basket of approximately 225 of Canada's largest publicly traded companies across energy, financials, technology, materials, industrials and other sectors. This article assumes that your business and the index have equivalent growth prospects, which is a simplification made purely for analytical clarity. Your industry may have growth tailwinds that justify holding through a higher-multiple sale cycle, or structural headwinds that accelerate the argument for exit. Owners must calibrate this framework against an independent assessment of their specific sector before drawing conclusions. An experienced M&A advisor with sector knowledge is essential for this step.
The question is not whether your business generates more revenue than the index. The question is whether your risk-adjusted, after-tax return on the equity locked in your business exceeds what you would earn by selling, paying tax and deploying the net proceeds into a diversified portfolio.
The following table illustrates the projected growth of the after-tax proceeds from the illustrative sale ($6,327,000 net) compounded at 8 per cent annually across three holding periods.
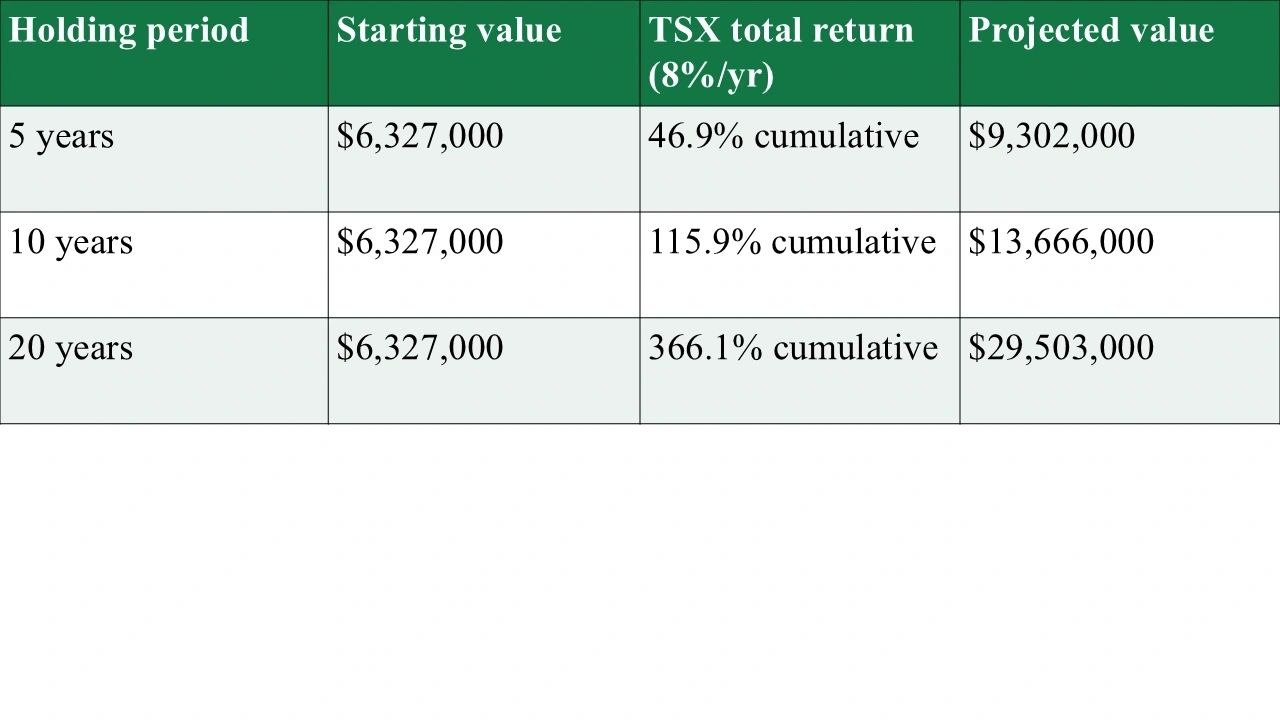
Over 20 years at 8 per cent, $6.33 million in after-tax proceeds grows to approximately $29.5 million. If your business cannot credibly deliver superior risk-adjusted growth over that horizon, and if your sector does not have exceptional growth prospects that the index does not reflect, the hold decision becomes difficult to defend on purely financial terms.
Three owners, three realities: how age changes the calculus
The hold-or-sell analysis looks different depending on where you sit in your life cycle. The intrinsic and market value framework stays constant. What changes is the weight you assign to time, tax deferral, opportunity cost, health, succession and legacy.
The following examples use three fictional founders, each owning a controlling interest in a Canadian lower-middle-market business with similar valuation profiles but dramatically different personal circumstances. All figures are illustrative and do not constitute tax advice. Taxes are estimated using top marginal rates in the applicable province and are not intended as a guide to individual tax planning.
Example 1: Margaret Okafor, age 79 — Okafor Industrial Supply Ltd.
Founder and sole owner; 43 years in business; annual revenue of $14M; EBITDA of $2.1M; based in Hamilton, Ont. No succession plan, no independent directors, audited financials as of last year, primary client accounts for 38 per cent of revenue.
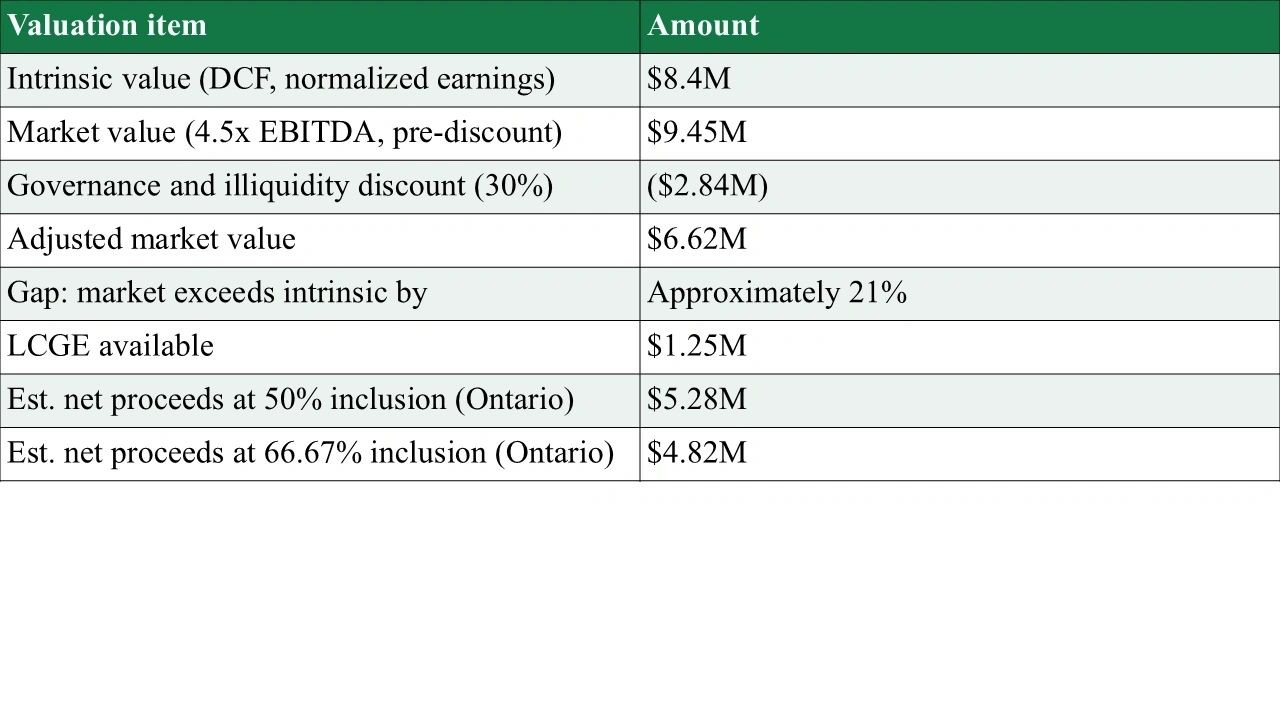
At 79, time is the dominant variable. Margaret has a functioning business, but her estate planning horizon is measured in years, not decades. She has already maximized her RRSP. Her financial planner confirms that net proceeds of $5.28 million, invested in a diversified income-oriented portfolio, fully fund her and her spouse's retirement needs with surplus for her estate.
Framework result: Market value exceeds intrinsic by approximately 21 per cent, a sell signal. More critically, Margaret's governance profile makes her business more attractive to sell now than later. Her primary customer concentration (38 per cent) is a risk that increases with each year of inaction. Her lack of a succession plan means that a prolonged health event could destroy the value she has built.
The risk of the proposed 66.67 per cent inclusion rate would cost Margaret an estimated $460,000 in additional tax. At her age, certainty is worth a premium. The recommendation is to begin a formal sale process immediately under the current tax regime. Delay is the highest-risk strategy available to her. The TSX opportunity cost argument runs in reverse here: at 79, a 20-year compounding scenario is not a relevant planning frame.
Key insight: For owners in late career, the financial framework may point to holding, but personal circumstances, governance risk and concentration issues often override it. Tax certainty, health, estate planning and the desire to control one's own exit are legitimate and powerful factors that the numbers alone cannot capture.
Example 2: David Arsenault, age 60 — Arsenault Engineering Solutions Inc.
Founder and majority owner (80%); annual revenue of $11M; EBITDA of $1.75M; based in Moncton, N.B. Two-person management team beyond the founder, reviewed financial statements, five-year municipal contract, top three customers represent 55 per cent of revenue.
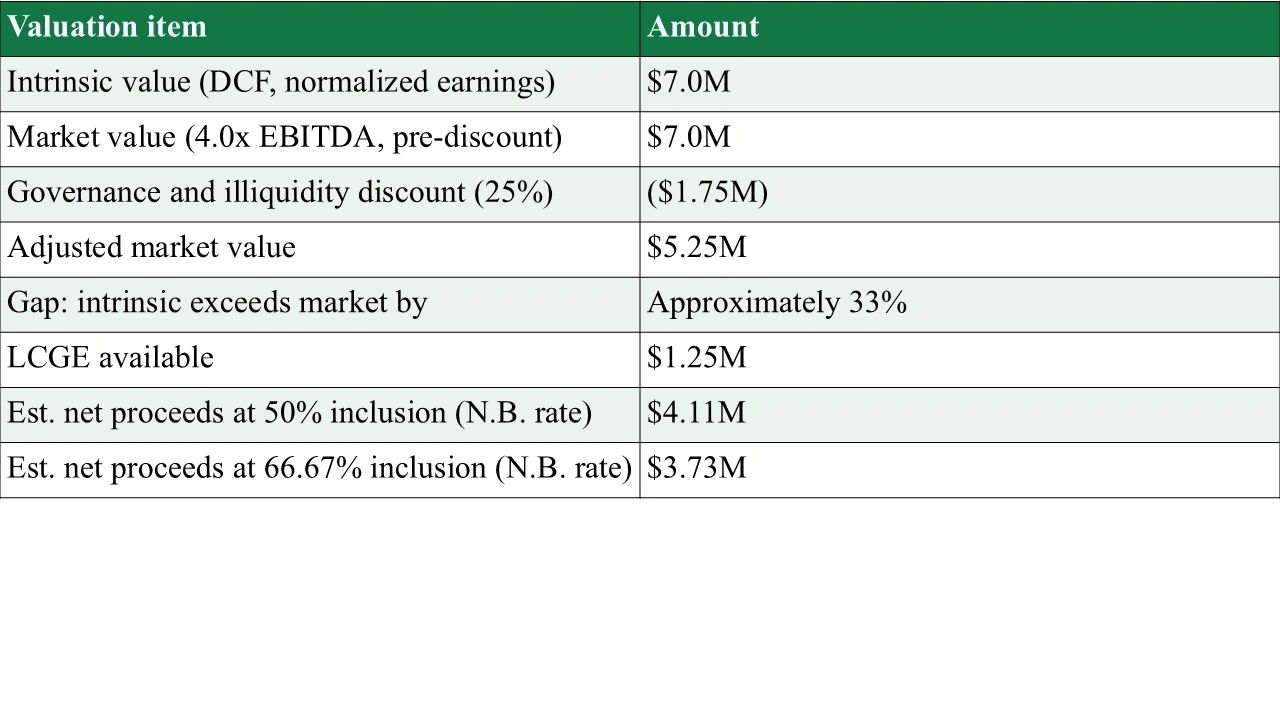
At 60, David has a planning horizon of five to 15 years before he would ideally retire. His intrinsic value meaningfully exceeds adjusted market value, a hold signal. The business has a strong recurring revenue component from a five-year municipal infrastructure contract, which the DCF model captures but comparable transactions do not fully reflect.
Framework result: Hold for 24 to 36 months and execute a concrete value-building programme. Specifically: upgrade financial statements from reviewed to audited, initiate the appointment of at least one independent advisory board member, accelerate business development to reduce the top-three customer concentration from 55 per cent toward 35 per cent, and document supplier agreements with dual-sourcing for the two highest-volume inputs. Each of these actions will compress the illiquidity discount at the next valuation cycle.
The tax exposure is meaningful. At the proposed 66.67 per cent inclusion rate, David would pay an estimated $380,000 more in tax on a sale today relative to the 50 per cent regime. With the current rate confirmed, his advisor recommends a formal annual valuation cycle and a pre-sale readiness plan targeting a 2027 transaction, allowing time for value-building activities to mature before going to market.
On the opportunity cost question: $4.11 million in after-tax proceeds at 8 per cent annually would grow to approximately $6.04 million in five years and $8.87 million in 10 years. His business, if it executes, is projected to reach $9 million in value by 2027. The value-building programme is the swing factor that justifies holding over the TSX alternative.
Key insight: The 60-year-old owner sits at the most analytically complex intersection. The financial case for holding is real, but it requires discipline, a concrete governance improvement plan and a defined exit date. A hold without a plan is not a strategy. It is procrastination with compounding consequences.
Example 3: Priya Malhotra, age 45 — Northern Tier Logistics Inc.
Co-founder and majority owner (70%); annual revenue of $9M; EBITDA of $1.4M; based in Calgary, Alta. Revenue growing at 18 per cent annually; management team of four; no audited financials; single-sourced for primary fuel and maintenance contracts; two customers represent 62 per cent of revenue.
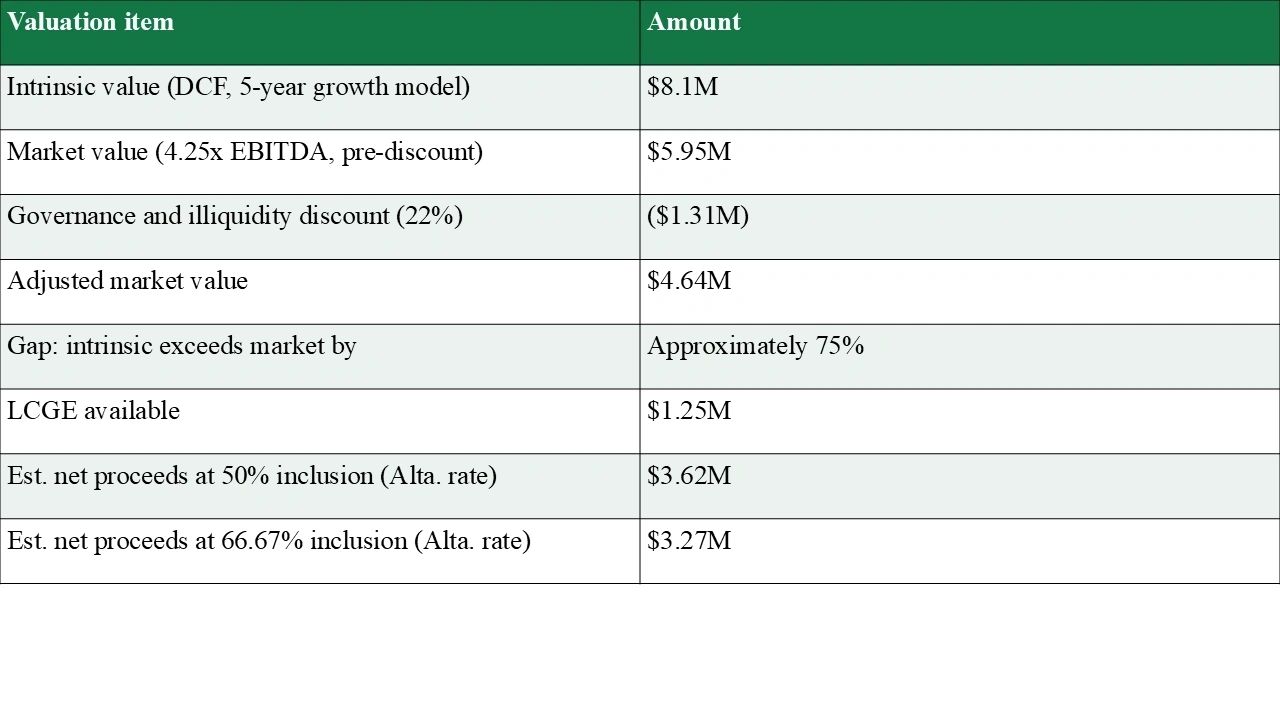
At 45, Priya has a 20-plus year horizon before conventional retirement age. Her business is in high-growth phase, with revenue expanding at 18 per cent annually on a compound basis over three years. The DCF model reflects a projected inflection point in year four as a new automated sortation facility comes online, which would push EBITDA to an estimated $2.6 million.
Framework result: Intrinsic value exceeds adjusted market value by approximately 75 per cent, a strong hold signal. However, Priya's governance profile is her most significant near-term risk. Her customer concentration is acute: two clients represent 62 per cent of revenue in a logistics business where client mobility is high. Her single-sourced fuel and maintenance contracts create operational fragility. These are not abstract risks; they are discount drivers that any sophisticated buyer will reprice aggressively.
The recommendation is to hold, but to treat the next 24 months as a governance investment period. Priority actions: initiate audited financial statements, negotiate a secondary maintenance supplier agreement, begin a business development campaign targeting at least six new clients to reduce the top-two concentration below 40 per cent. These steps will likely reduce the illiquidity discount from 22 per cent to 15 to 18 per cent at the next valuation cycle, which at Priya's current EBITDA level represents approximately $400,000 to $600,000 in additional value.
The fiscal risk deserves monitoring. If a future government reintroduces an inclusion rate of 66.67 per cent or higher, the after-tax cost would be an estimated $350,000 higher than under the current regime on a sale today. At Priya's stage, the best mitigation is not to sell prematurely, but to ensure her corporate structure is optimized for the LCGE and to track legislative developments annually. Given Canada's fiscal trajectory, this is not a theoretical risk.
On opportunity cost: $3.62 million in after-tax proceeds at 8 per cent annually would grow to approximately $7.8 million in 10 years and $16.9 million over 20 years via the TSX. Priya's business, at its projected value, would reach $15 million to $18 million within seven to 10 years of disciplined execution. That asymmetric growth potential justifies the illiquidity and the concentration risk, provided she executes the governance programme.
Key insight: For a 45-year-old owner with genuine growth assets, the annual valuation exercise is not about deciding whether to sell. It is about tracking the gap between intrinsic and market value, identifying governance risks that compress buyer willingness to pay, and protecting optionality. The decision to hold should be deliberate, documented and tied to a specific improvement programme.
How to make this an annual habit
Business experts recommend embedding this exercise into your annual strategic planning cycle. A practical cadence:
- Trigger the review at the start of your fiscal year or when a material event occurs: an unsolicited offer, a key employee departure, a major contract win or loss, or a significant shift in interest rates.
- Update your financials, including trailing 12-month revenue, EBITDA and free cash flow, before any analysis begins.
- Engage an independent M&A advisor or chartered business valuator (CBV). Costs typically range from $10,000 upward for a formal engagement.
- Model three scenarios: base case, optimistic and pessimistic. Scenario planning surfaces the range of outcomes and prevents anchoring on a single number.
- Re-run the tax scenario annually. Inclusion rates, LCGE limits and entrepreneur incentives are all subject to legislative change. Canada's fiscal trajectory means this variable warrants ongoing attention.
- Assess your governance gap annually. Customer and supplier concentration, leadership succession depth, financial statement quality and board composition all affect your illiquidity discount and should be tracked against your value-building programme.
- Reassess sector growth prospects. If your industry is facing structural headwinds, the opportunity cost argument for holding weakens. If your sector is accelerating relative to the broad market, a higher intrinsic value may be justified.
Partial transactions, such as divesting a 20 per cent stake to a financial partner, offer a middle path. They allow founders to monetize a portion of their equity, reduce personal concentration risk and retain operational control without triggering a full exit.
The cost of skipping this exercise
Owners who do not undertake regular valuations face two common failure modes. The first is underselling: accepting an offer that feels large in absolute terms but represents a fraction of the business's true worth, simply because the seller had no independent benchmark. The second is prolonged holding: staying in through a downturn because the decision to exit was never made with discipline, waiting instead for conditions that may not return.
Both outcomes are avoidable. The annual valuation exercise does not guarantee a perfect decision, but it dramatically narrows the range of bad ones.
Sources and references
Government of Canada, Notice of Ways and Means Motion, June 10, 2024 (canada.ca)
Government of Canada, Annual Financial Report 2024-25, Oct. 2025 (canada.ca)
Office of the Prime Minister, Prime Minister Carney cancels proposed capital gains tax increase, March 21, 2025 (pm.gc.ca)
Parliamentary Budget Officer, Economic and Fiscal Outlook, March 2025 (pbo-dpb.ca)
TD Economics, Federal Budget 2025, November 2025 (economics.td.com)
S&P Dow Jones Indices, Reflecting on 25 Years of the S&P/TSX Index Series, 2023 (spglobal.com)
PortfoliosLab, S&P/TSX Composite Index Total Return, December 2025 (portfolioslab.com)
MNP, What the capital gains inclusion rate change means for professionals, 2024 (mnp.ca)
Fasken, Selected Tax Measures in the 2024 Federal Budget, April 2024 (fasken.com)
Fraser Institute, The Growing Debt Burden for Canadians, 2025 (fraserinstitute.org)
CBC News, capital gains legislative coverage, June 2024 (cbc.ca)